Effective learning is about more than simply delivering content. It is about understanding how learners engage, the decisions they make and the insights that can be gained from those interactions.
As part of Near-Life’s ongoing platform development, we’re pleased to announce a number of enhancements to our learning analytics capabilities.
The platform already supports industry standards including LTI, xAPI and SCORM, allowing organisations to integrate learning experiences into their existing ecosystems and reporting workflows. However, interactive scenarios generate a much richer set of data than traditional learning content.
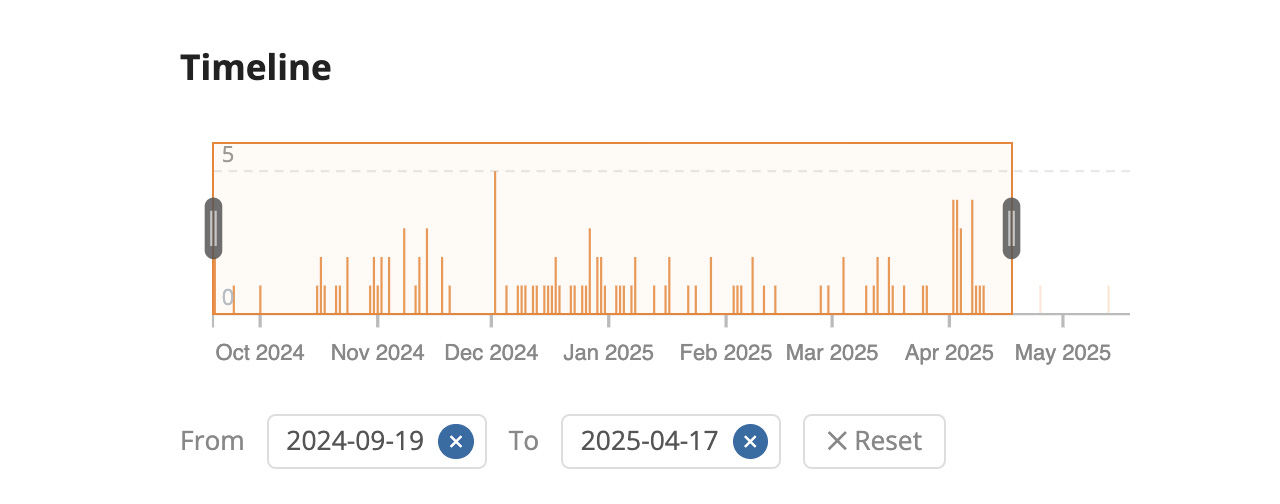
Our latest analytics update makes it easier to explore and understand that data. Users can now filter analytics more effectively by date and time period, helping learning teams identify trends, compare activity across cohorts and focus on the information most relevant to them.
We’ve also introduced a new scenario heat map, providing a visual representation of how learners navigate through interactive experiences. This makes it easier to see the pathways people take, where engagement is strongest, and where learners may be dropping off or encountering challenges.

For organisations using branching scenarios, simulations and immersive learning experiences, these insights can be invaluable. They help move beyond completion rates and scores, providing a clearer understanding of learner behaviour and decision-making.
Near-Life CEO Mike Todd stated:
“Analytics are central to how we see learning at Near-Life. It isn’t just about the content; it’s understanding how people engage with that content, how that engagement can be measured, and what organisations can learn from it.”
This update represents another step in our vision of combining engaging learning experiences with meaningful analytics. Near-Life helps organisations not only deliver learning but continually improve it.
To find out more, book a demo with our team.